Caching: is it working, what did it save, where is it missing
Prompt caching is the largest single lever on model cost, and a cache that silently stops hitting can multiply a bill while nothing else looks wrong. The Cost page, on the Waste and savings tab, under "Is the cache working?", shows whether it works. A finding says when it stopped.
Every money figure is an estimate from your own price table. Provantix ships no prices: set the cached-input and cache-write prices for a model (see price table) or its cache tokens are counted and named but not valued. No prompt content is read or stored.
In the product
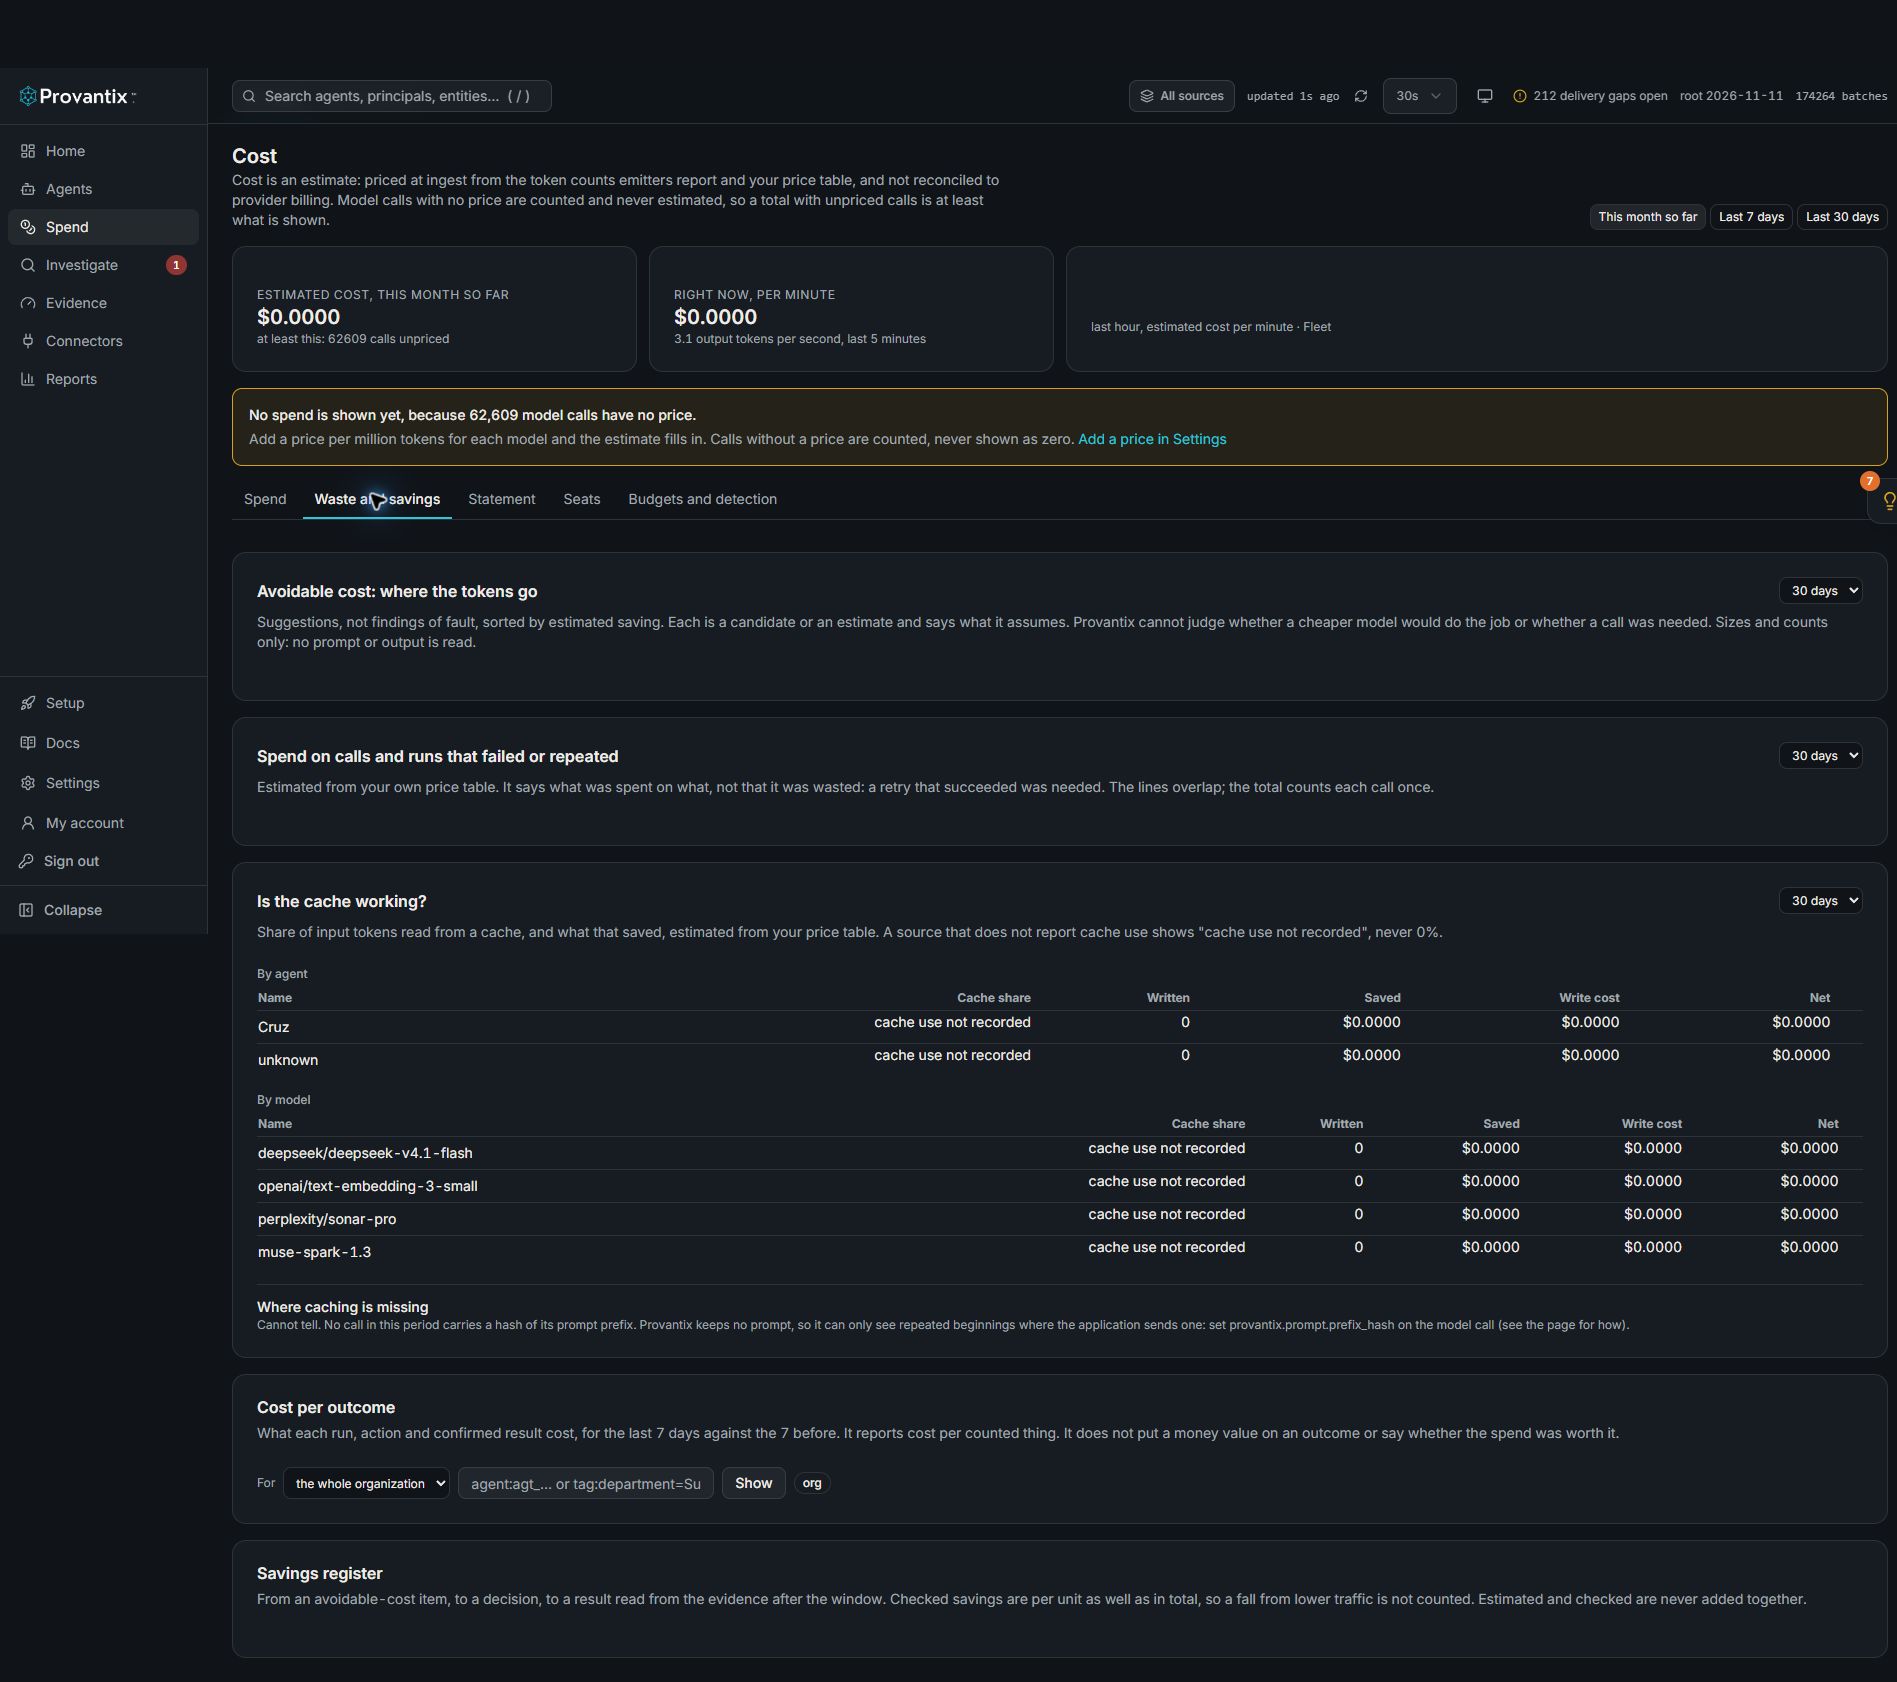
Product capture, 15–16 November 2026. Open the image for full size. Counts and dates are examples from the captured workspace.
In Waste and savings, find Is the cache working? This example says cache use not recorded and cannot identify repeated prompt prefixes. Neither state proves that caching is absent; the necessary telemetry was not supplied.
What is shown
For each agent, model and workflow (a workflow is the tag workflow, where you set one), and as a trend per day:
- Cache share. Tokens read from a cache divided by input tokens, over the calls whose source reported cache use. Input tokens include the cached part, as everywhere in Provantix.
- Written. Tokens written to a cache.
- Saved. Tokens read from a cache × (the normal input price − the cached price).
- Write cost. Tokens written × (the cache-write price − the normal input price): the extra paid to write the cache.
- Net. Saved minus write cost. A cache that costs more than it saves, with writes paid for and seldom read, is marked, with both sides of the sum in the row. "Seldom read" means more tokens written than read.
A source that does not report cache use shows "cache use not recorded". Those calls are left out of the share, never counted as 0%, and never raise the finding. A recorded zero (the source says nothing was read) is 0%, which is different.
The finding: cache hit rate fell
It opens when an agent's cache share over the last 3 days is at least 20 points below its own share over the 14 days before, and:
- both sides have at least 30 calls that reported cache use (low volume does not open it);
- the earlier share was at least 20% (there was a cache worth losing).
It states the before and after figures, the calls and input tokens behind each, the estimated extra cost a day (the input that would have been read at the earlier share, at the price difference in your table), the first day and the first run with no cache reads that day, and how many recent calls did not report cache use and are not counted. Where configuration is recorded, it says if a flag variant first appeared within a day of the change. That is a coincidence in the records, not a cause.
It cannot say why. It closes when the share recovers or the calls leave the window.
Where caching is missing
Caching works on the beginning of a prompt. Provantix keeps a hash of the whole prompt, not the beginning, so it can only see repeated beginnings where the application sends a hash of the stable part itself:
- OpenTelemetry attribute
provantix.prompt.prefix_hashon the model call: the hex sha256 (16 to 128 hex characters) of the stable prefix or the system prompt, computed in your code. - With the Provantix SDK:
model.promptPrefixHashon the model call.
Anything that is not a hex hash is ignored, so a prompt cannot be sent by mistake.
Without it the page says cannot tell. With it, each candidate is the same beginning sent several times, inside a cache lifetime, with no cache read. It shows how often, the input tokens involved and an upper bound on the saving if it had been cached at the cached price. The assumptions are stated: the shared beginning meets the provider's minimum cacheable size (calls under 1,024 tokens are left out) and calls within five minutes fall inside the cache lifetime. The saving is "up to" because the prefix cannot be larger than the shortest call and may be smaller.
What each provider does, and what Provantix assumes
Read from the providers' documentation on 2026-11-15. Check it again before relying on a detail: this changes.
| Anthropic | OpenAI | |
|---|---|---|
| Turned on by | You: a cache_control marker on the request or on blocks (up to 4 breakpoints) |
Automatic for supported models |
| Lifetime | 5 minutes by default, refreshed at no cost each time the cache is used; 1 hour optional | Varies by model: in-memory (minutes of inactivity) or longer retention; newer models 30 minutes or 12 hours |
| Minimum size | 512 to 4,096 tokens, by model | 1,024 tokens on the newest models; earlier models vary |
| Write charge | Yes: 1.25× the input price (5 minutes), 2× (1 hour) | Newest models: yes (1.25× for 30 minutes, 2.5× for 12 hours); earlier models: none |
| Read price | 0.1× the input price, lower on some newer models | A discount, up to 95%, by model |
| Reported as | cache_read_input_tokens and cache_creation_input_tokens, and input_tokens excluding them |
cached_tokens inside the usage details; writes separately on the newest models |
Provantix adds Anthropic's three input figures up before storing, so tokens_in always includes the cached part. It does not assume a lifetime, minimum or price: prices come from your table, the 1,024-token minimum and five-minute lifetime in the candidate estimate are the conservative common case and are stated where they are used. For other providers, Provantix assumes nothing: cache use is shown only where the source reports it.
Runbook: the cache hit rate fell
The usual reasons, none of which Provantix can confirm:
- The start of the prompt changed. A timestamp, a request id, a user name or a reordered tool list near the top. Caching matches the beginning exactly, so one changed character before the stable part defeats it. Compare the start of the first run with no cache reads with an earlier run that did read the cache.
- A model or version changed. A cache is per model. The finding's first day is the day to look at deploys.
- The cache lifetime was exceeded. Calls came further apart than the lifetime (a lower traffic day, a changed schedule). Consider the longer lifetime where the provider offers one, weighing the higher write price.
- The marker or setting was dropped. On providers where you turn caching on, a code change may have removed it.
- The source stopped reporting. Not a fall at all: calls that report no cache use are not counted, so this does not open the finding, but check that cache fields still arrive.
If a flag variant is named in the finding, look at what it changed, but remember it is only a coincidence in time.
API
GET /api/cache?from=&to=&agent= returns the figures, the trend and the candidates. A period is at most 92 days.