Reading the Home page
Home is the morning-check page. Its job is to answer four questions in ten seconds: Was the period normal? What is it costing? What is wrong? What do I do first? Everything on the page exists to serve one of those four questions.
In the product
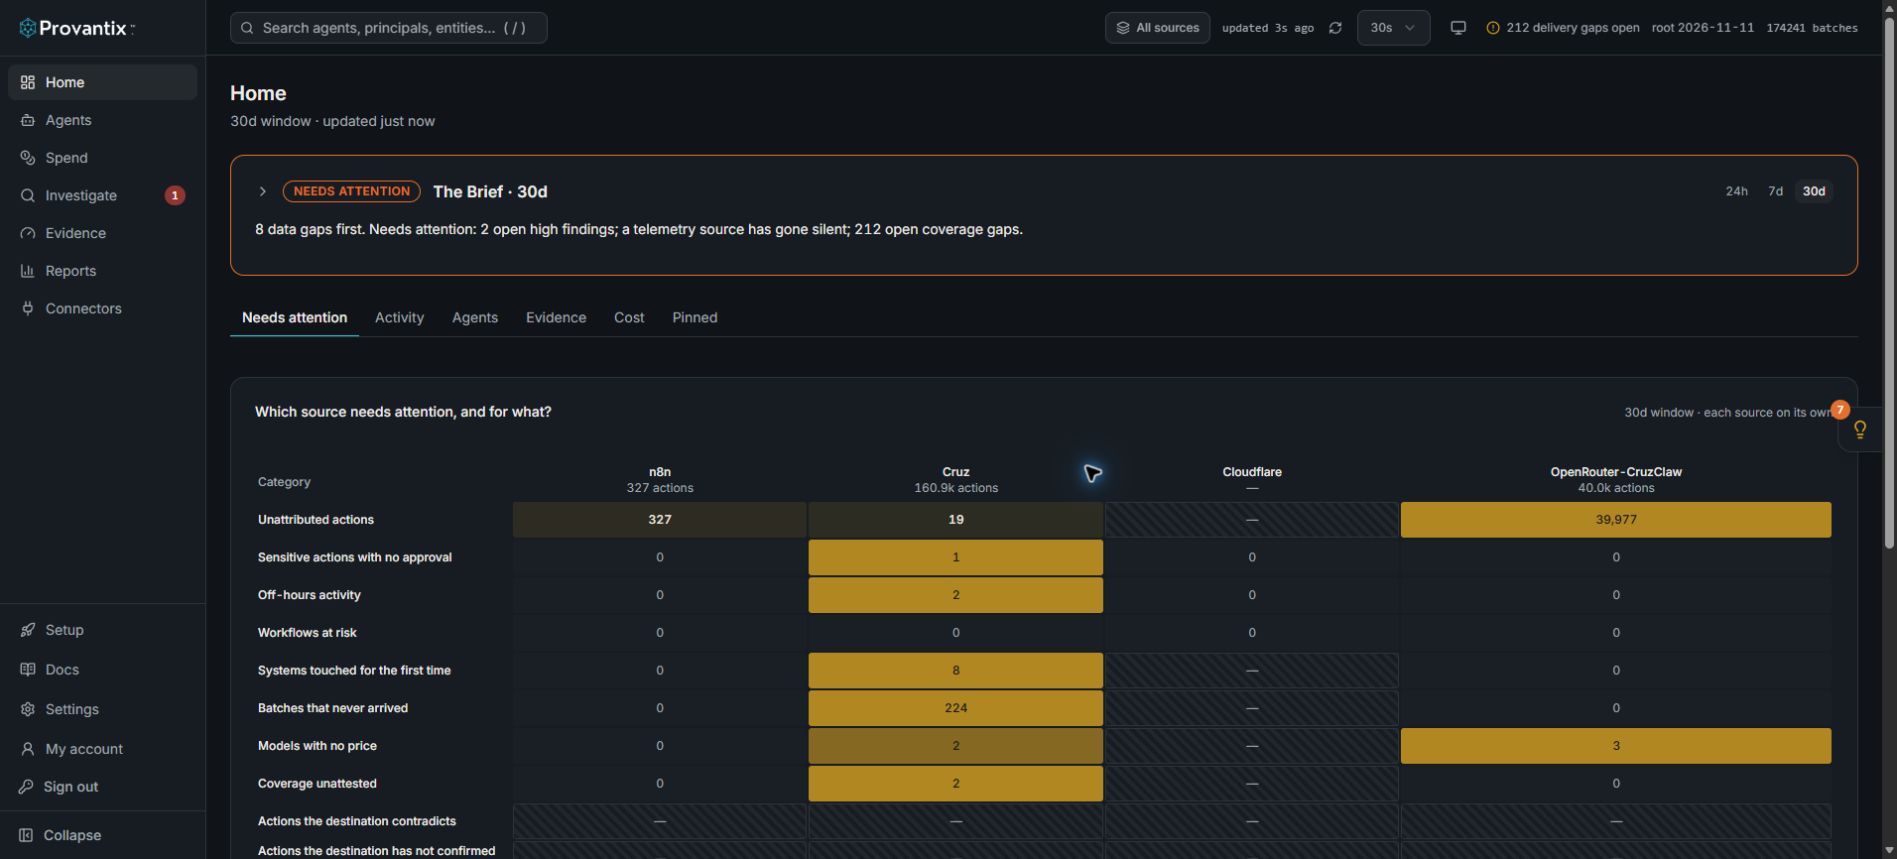
Product capture, 15–16 November 2026. Open the image for full size. Counts and dates are examples from the captured workspace.
Each heatmap column is a source. Compare colours within a row: different rows measure different things. A dash means not measured; zero means none counted. The screenshot is an attention state, not an example of a healthy workspace.
The tabs under the Brief
The Brief stays at the top, whichever tab is open. Below it, the page is split by the question each part answers. A tab has its own address (?tab=), so a link opens it.
| Tab | What is on it |
|---|---|
| Needs attention (the first tab) | The source-by-category heat map, the alerts and attention queue, whether problems are opened faster than they are closed, and who approved the sensitive actions. |
| Activity | How much the agents did, who did it and when it changed, and when the agents act, including how much of it is outside business hours. |
| Agents | The agent table, the systems the agents touch and their reach. |
| Evidence | The posture calendar (click a day to filter the cards), the daily roots, coverage and sources. |
| Cost | Cost over time, who pays for it, and the health of the model work. |
| Pinned | What your organization chose to watch. |
The heat map and the approvals card read each source on its own and can take a couple of seconds on a large organization. They show a short "reading" line until they are ready, and the grid is kept for a minute so the next view is immediate.
The Brief, top of page
The Brief is one generated sentence that states the week's story in plain words, for example: "Cruz ran 1,801 actions in the last 7 days, 0% unattributed. No action seen in the last 7 days was outside the access marked as expected. Evidence is incomplete: 9 sequence gaps in the window; the emitter owner should check for a restart." When nothing is wrong the sentence says what was checked and what that does not show: "No batch gaps or rejected batches in the last 7 days; 6 of 6 sealable days rooted. That shows what was delivered was not altered, not that every action was captured." It never says "all activity captured": a statement of completeness always names what was checked.
Read it first. It is assembled from templates over the stored data — it never guesses — and every claim in it links to the evidence behind it. If the Brief says "all attributed" and you want to check, the attribution tile below carries the number and the link.
Next to the sentence sits the verdict for the selected window: one word such as clear, watch or attention, derived from the same rules the posture calendar uses. It is not a score and it is not blended — when the verdict is attention, one of the trend tiles or the attention queue says why.
Where a reconciliation scope exists, the Brief also counts the actions the destination system has not agreed with. A destination that contradicts an agent's claim makes the verdict attention, because the two records disagree. Actions the destination has not yet confirmed, or could not verify, make it watch. Neither is treated as a failed action: the destination not showing a record is not evidence that nothing happened. Each count links to the matching actions in Investigate (the field Destination check).
The five trend tiles
Five sparklines, one per concern: Activity, Cost, Risk, Coverage, Integrity. Each tile shows the last seven days as a sparkline, a direction arrow and one word of judgement.
- Activity — actions per day. A sudden drop can mean an agent stopped; a sudden spike can mean a loop or a new agent appearing.
- Cost — spend per day across models. Hover for the split by model; the strip links to Cost for the full breakdown.
- Risk — open findings, weighted by severity. There is deliberately no blended risk score: hover the tile to see the weights, and open Findings for the list.
- Coverage — how much of your telemetry arrived with full attributes versus partial. Falling coverage usually means an emitter is sending less than it should.
- Integrity — batch gaps, rejections and verification state. Anything above zero deserves a look at Connectors.
A tile turning amber is an invitation to click through, not an alarm by itself.
The feed: what changed
Below the tiles, what changed is a feed of one-sentence events, newest first: an agent appeared, a finding opened, a batch gap surfaced, a budget tripped, an emitter went silent. Repetitive events are grouped ("12 similar"). Each entry links to its evidence — a finding entry opens the finding, a gap entry opens the affected window in Investigate.
This is the page's honest answer to "what is wrong": not a count, but the specific things that changed and where to look.
Forecasts
The forecast row answers "where is this heading?" with plain arithmetic over data already stored: cost at month end at the current burn rate, the day a budget runs out, when the next day seals. Forecasts are estimates, labelled as such, and they recompute with the window selector.
Which source needs attention: the heat map (Needs attention tab)
When an organization has two or more sources, Home shows a heat map: one column per source, one row per category (unattributed actions, sensitive actions with no approval, off-hours activity, workflows at risk, systems touched for the first time, batches that never arrived, models with no price, coverage unattested). Each cell is the count for that source in the window.
- Colour runs light to dark on one scale, and the darkest cell in a row is that row's highest count. It compares sources within a row only: rows count different things (records, findings, gaps), so colour is never compared across rows. A cell's tooltip says what share of the row's highest it is.
- A flat grey 0 means none. A hatched dash means not measured for that source, which is not the same as none.
- Two rows count actions the destination contradicts and actions the destination has not confirmed or could not verify. A dash means no reconciliation scope exists for that source.
- Click a cell to open that category for that source. Sources are never added together.
Who approved the sensitive actions
A card near the middle of the page counts the sensitive actions in the window that carry a human approval and those that do not, lists the approvers with the most approvals (as handles, never names) and the agents with the most actions without one. Each number opens the matching actions in Investigate. If no approval has ever arrived, the card says that the gap is in the setup, because Provantix stores an approval only when your application sends it with the action. See Approvals: who approved what.
The attention queue
Up to three items that need a human, each with an owner, an age and the impact in one phrase — "Emitter cruz silent for 6h, 412 records behind, owner: platform-team". Work the queue top to bottom; items you resolve strike through for a day and then leave the list.
Ask a question
The question box above the fold accepts plain English over your organization's records — "what did the finance agent do yesterday?" — and answers with a chart or a table you can pin to a dashboard. Three suggested questions are drawn from this window's actual events; they are starting points, not the only things you can ask. See Reports and dashboards.
The window selector
Every number, tile, forecast and feed entry follows the selected window — 24 hours, 7 days or 30 days. When you change it, the whole page re-renders from the same data. If a comparison says "prev —%", the previous window is empty (for example right after onboarding); that is normal and resolves as history accumulates.
What to conclude
Leave Home with one sentence you could say to a colleague: "Week was normal, spend on trend, one medium finding on the reports agent, evidence complete." If you cannot form that sentence from the Brief, the tiles and the queue, something on the page is failing its job — tell us.