Spend by tag, and who did it
Finance asks who spent how much, on what. The Cost page answers it by the cost tags on each call (department, cost center, product, project, environment and any other tag your telemetry carries), by agent, by model and by provider, and it ties every figure back to the calls behind it.
In the product
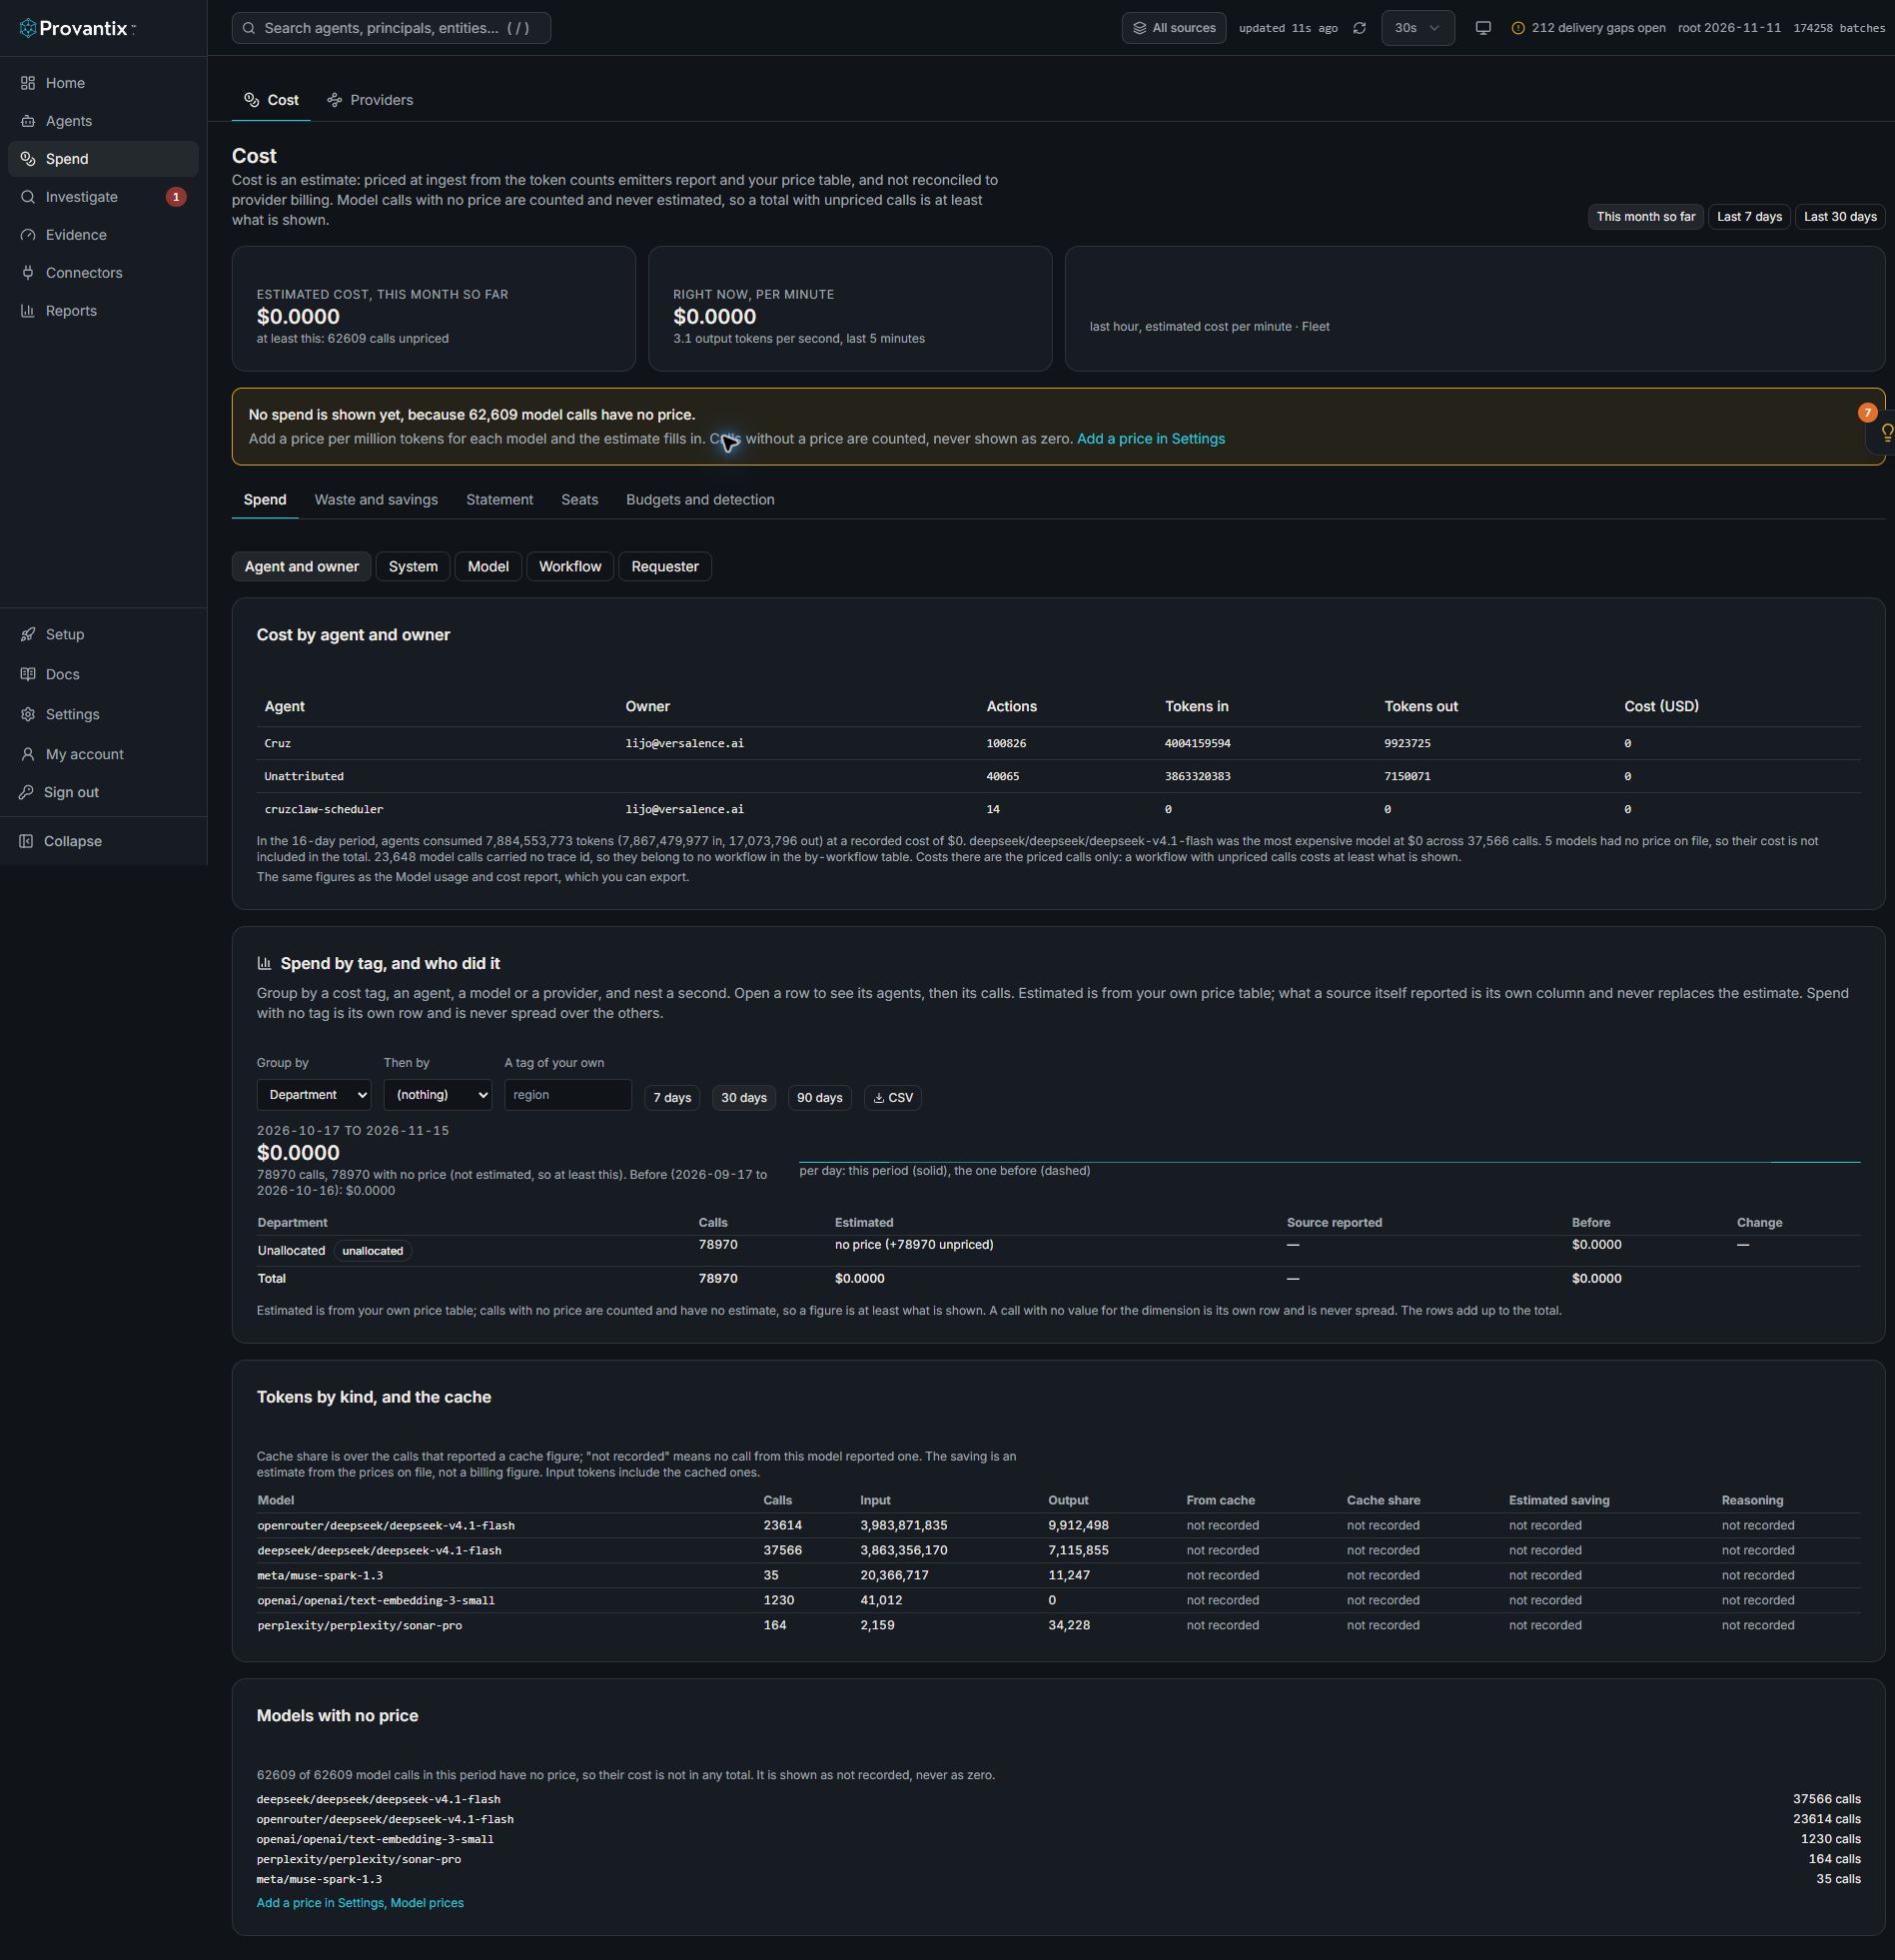
Product capture, 15–16 November 2026. Open the image for full size. Counts and dates are examples from the captured workspace.
Under Spend by tag, choose Group by and optionally Then by. Estimated and Source reported are separate columns. This example has no department allocation, so the calls stay in Unallocated; they are not distributed across other rows.
Group, nest, and open a row
Cost, Spend by tag, and who did it. Choose what to group by, and a second dimension to nest under it (department, then product). Click a row to open it: you see that row's spend grouped by agent, then by model, and Show the calls lists the calls themselves. Each call opens as the same sealed record the audit side shows, and links to its run. That is the link between what was spent and who did what.
- Estimated is Provantix's figure from your own price table. Source reported is what the source that sent the call says it cost (Langfuse, LangSmith, or a span that carries
provantix.usage.cost_usd). They are separate columns and neither replaces the other. A figure reconciled against a provider's invoice appears when reconciliation exists. - A call with no price is counted and has no estimate, so a total is at least what is shown.
- Every row shows the previous period (the same number of days just before) and the change, and the trend is drawn per day, this period against the one before.
Unallocated and unmapped
A call with no value for the dimension is its own row, Unallocated, and is never spread over the others. When the dimension is filled from the people directory, the unallocated row also says how many of its calls name a person who is not in the directory (unmapped).
The rows add up to the total. Folding small groups loses nothing: the folded line is in the total.
Who can see a person's spend
Grouping by person is not offered on the page. Through the API it is available only where your organization turned person-level spend on, and only to an admin; anyone else is refused and told why, with department totals still available. A department with fewer people than your minimum is folded into one shared line. Spend per person is never returned over MCP. See People and departments.
Budgets by tag value
A budget can be set on any tag value, written department=Sales or product=CRM, monthly with an optional daily cap, like an agent or team budget. Each budget can name an owner, the person who is to be told. A budget is a statement compared with recorded spend. Nothing is blocked.
Forecast. For every budget, the Cost page says where the month is heading. The method is stated beside it: the average daily spend over the last 7 complete days (at least 3 days of history), carried forward to the end of the month. With less history it says not enough data instead of a number. It assumes the recent pace continues. It does not know about weekends, releases or a new workload.
Threshold events. The first time a budget reaches 50%, 80% and 100% of its monthly cap in a month, and the first time its forecast says it will pass the cap, an event is recorded with the owner named on the budget. Crossing again in the same month adds nothing; a new month starts clean. Detection and alerting read these events.
Filters elsewhere
- Investigate has a Cost tags group of filters: any tag value, or none.
- Fleet can show only the agents whose recent calls carry a tag value, for example
department=Sales.
API, CSV and MCP
| What | How |
|---|---|
| Breakdown | GET /api/cost/breakdown?group_by=tag:department,tag:product&from=2026-11-01&to=2026-11-30, with filter=tag:department=Sales to open a row (filter=tag:department=%00 is the unallocated row) |
| CSV | the same address with .csv: GET /api/cost/breakdown.csv?... carries the same rows, the folded line and the total. A value that starts with =, +, - or @ is defused so a spreadsheet does not run it |
| The calls | GET /api/cost/records?filter=...&limit=50 |
| Budget events | GET /api/budget-events |
| MCP | the get_cost_breakdown tool, with the same arguments |
The page, the API, the CSV and the MCP tool read the same function, so they cannot differ.