Reports and dashboards
Investigate answers "what happened" one row at a time; Reports answers its aggregate form: how much, how fast, how reliably, and for how long? It is the analytics side of the same verified records — every chart drills down to the same rows you would see in Investigate.
In the product
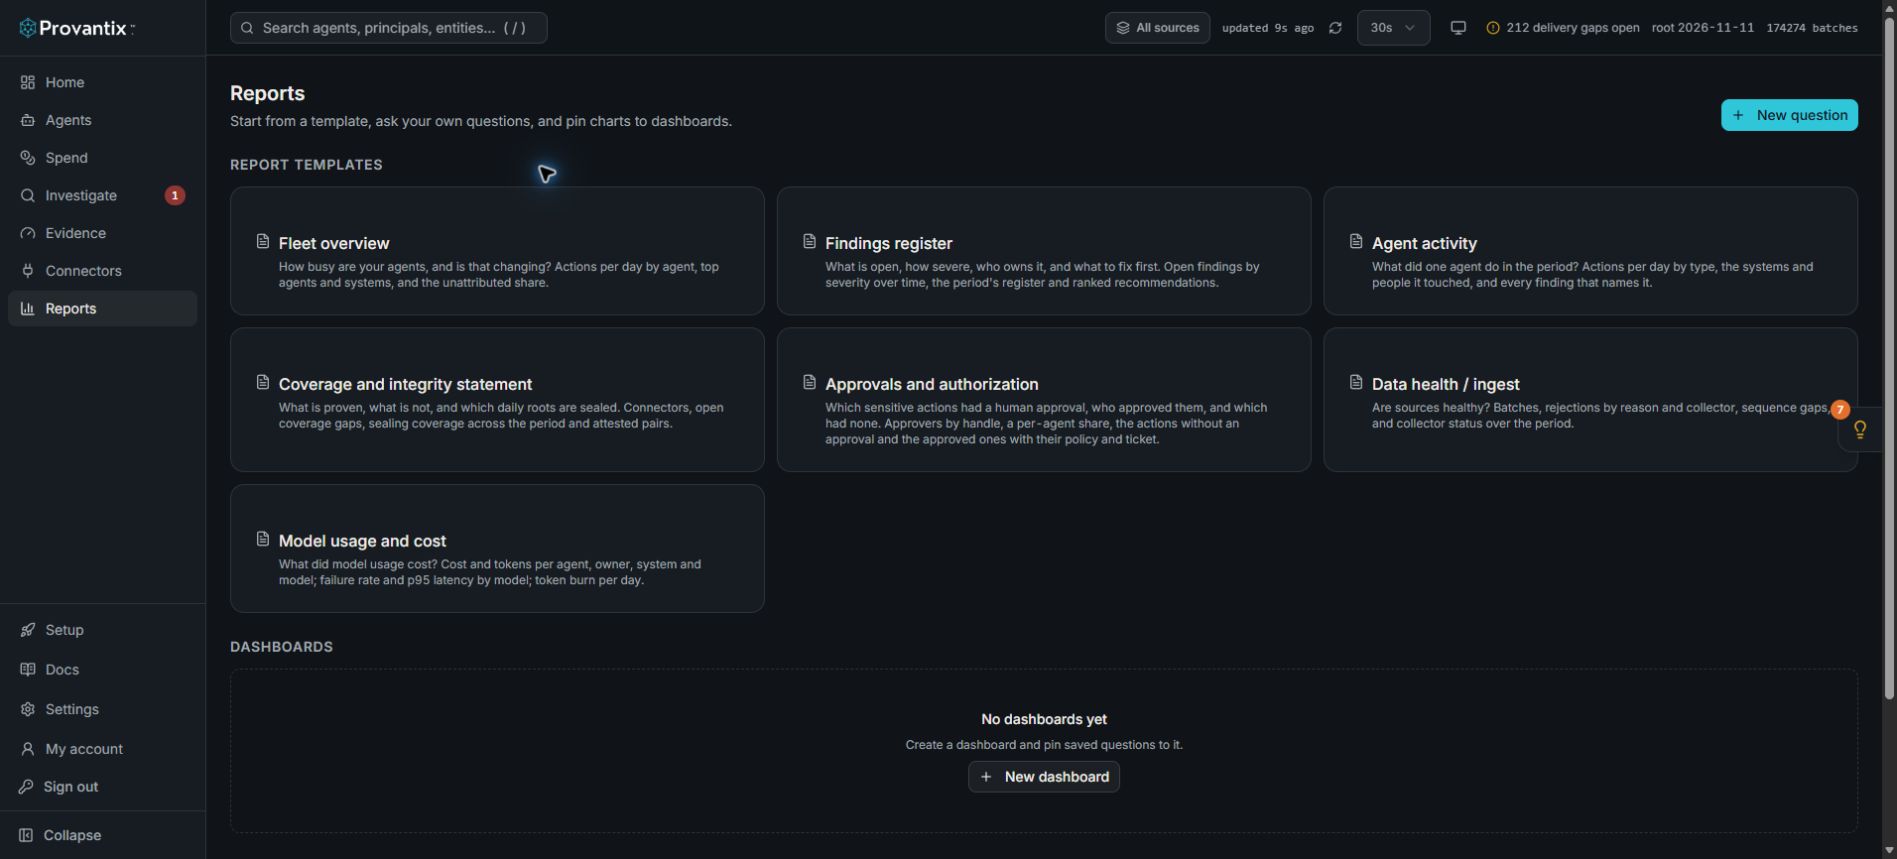
Product capture, 15–16 November 2026. Open the image for full size. Counts and dates are examples from the captured workspace.
Choose a template for a repeatable question or New question for a custom one. The captured workspace has no saved dashboards or questions. Templates are entry points; opening this page does not create an export.
Starting points
- Templates are pre-built questions for the analyses every organization eventually wants: activity by agent, cost by model, failures over time, coverage trend, finding resolution time, and Approvals and authorization (which sensitive actions had a human approval, who approved them as handles, and which had none; see Approvals: who approved what). Open one, adjust the window or filters, and you have an answer in seconds.
- Ask your own question in plain English over your records — the same box as on Home. Questions you save become cards you can pin.
- Dashboards are collections of pinned cards — your organization's standing views. Build one for the platform team (activity, gaps, emitter health) and one for finance (cost by owner, budget burn).
Model usage
The model usage report is where AI spend becomes legible. The Cost page shows the same figures with the burn rate, budgets and unpriced models beside them.
The report:
- Cost over time by model, with your month-end forecast at current burn and budget lines overlaid. When the forecast crosses a budget line, the day of exhaustion is labelled.
- Tokens in and out per day, per model — the raw material of the bill.
- p95 latency and failure rate per model — the quality side of the same traffic. A model that got cheaper but now fails 4% of the time is not cheaper.
Two more tables answer "which workflow cost this?" and "who asked for it?":
- Cost by workflow. One row per trace, the calls one run made: when it started, how many agents took part, the model calls, the tokens, and the priced cost, most expensive first. A workflow with unpriced calls (a model with no price on file) shows how many, beside a cost that is a floor: it costs at least what is shown. A workflow whose calls are all unpriced shows no cost, not zero. A model call with no trace id belongs to no workflow, and the narrative says how many there were, so the table never looks complete when it is not.
- Cost by requester. One row per requester handle: the keyed handle the product uses for people, never a name or an address. It is the first human in the record's on-behalf-of list, as the run view reads it. Records whose requester was not recorded, or was erased, are one row called "No requester recorded". The rows add up to every model call in the period.
Neither changes how cost is recorded or priced: they read the same figures, grouped differently.
One caveat the page is honest about: cost and token tiles are only as good as what emitters report. If an agent routes its model calls through a gateway that does not report usage, its cost shows zero here while its activity shows up everywhere else — a gap in cost visibility, not free usage. Connectors shows whether the source reports usage; independent gateway evidence (for example an OpenRouter intake) closes the gap without code changes on the agent.
Budgets
Budgets attach a monthly cap to an agent, a team or the whole organization. When spend crosses the cap, a finding fires, the forecast labels the exhaustion day, and any notification channel you have wired (email digest, webhook) carries it. Budgets are decisions: creating or changing one lands in the decision log.
Exporting
Every table and chart exports: CSV for the rows behind a table, PDF for the whole report, and the full evidence bundle for audit delivery — sealed records, daily roots, attestations and the signed verification manifest, in a format that verifies offline. The bundle is the artifact you hand over; a screenshot of a chart is not evidence, and the product never asks you to pretend it is.
The PDF
Export PDF on a report page downloads the report as it appears: the headline numbers, the written summary, the over-time table and every table (up to 200 rows each; the CSV has all of them). It is a readable copy for people, not evidence. The last section says so, and gives a data fingerprint: the SHA-256 of the figures in the report (template, period, headline numbers and table rows). The same figures always give the same fingerprint, so a later run, or a CSV export of the same period, can be compared with it. The fingerprint does not include when the PDF was made or the wording of the summary. For something an auditor can verify, hand over the evidence bundle instead.
What to conclude here
Reports is where you turn telemetry into standing answers: the cost review, the reliability review, the coverage trend for the governance meeting. If a number here surprises you, click it — you will land on the rows that produced it, verified the same way as everything else.