Records and Investigate
A record is one attributable action by one agent at one moment: agent Cruz called tool send_email on system mail at 09:41, outcome success, attributed to owner lijo with confidence 0.92. Read the record's provenance and integrity information to establish where it came from and what can be verified. An emitter seal, a stored record hash and a destination confirmation are different evidence. A record reports an action; it does not by itself prove the action happened or was correct.
Investigate is the page where you read records.
In the product
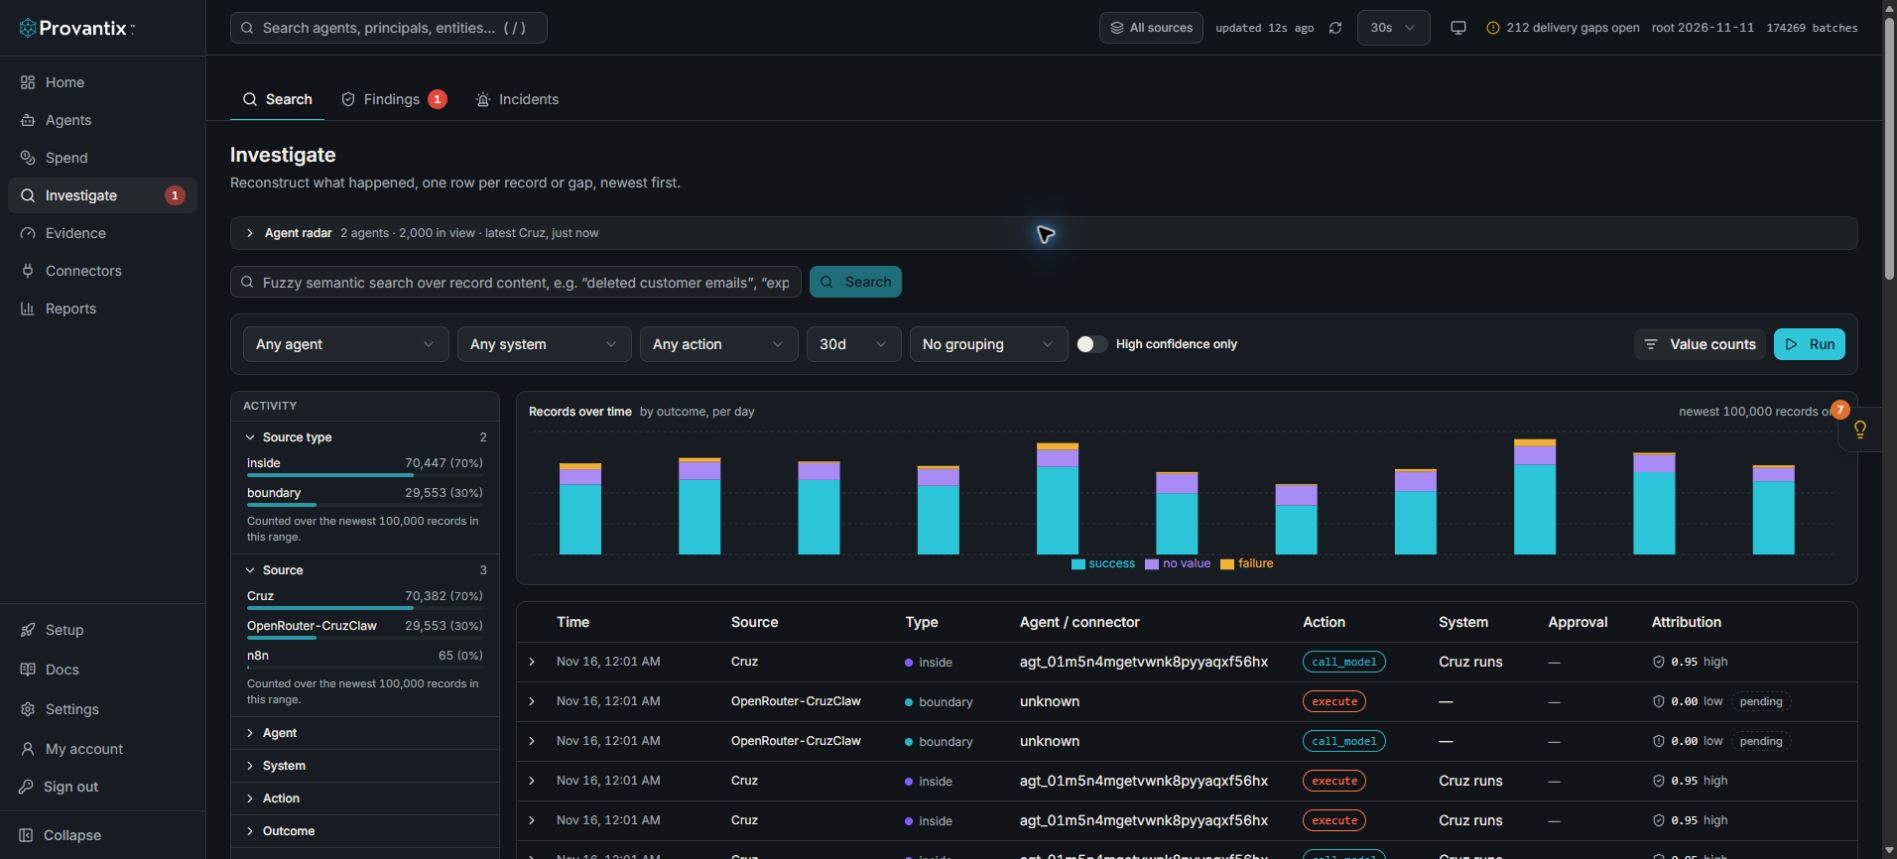
Product capture, 15–16 November 2026. Open the image for full size. Counts and dates are examples from the captured workspace.
Use the filters and Value counts to narrow the records before opening a row. The table is capped at the newest 2,000 matching rows; narrow the date range or filters for older evidence. Counts may cover the newest 100,000 records and label that limit.
The timeline
The main table is the timeline: one row per record, newest first, each row showing when, which agent, what action, on which system, with what outcome. The subtitle tells you exactly what you are looking at — "latest 2,000 of 17,109 in range" means the window matched 17,109 records and the table shows the newest 2,000; the pager moves through those 2,000 rows. Narrow the range or filters to reach older records outside that cap.
Between records you may see gap rows — hours where a batch sequence skipped. A gap is not a missing record; it is the platform reporting "the emitter signed batch 10482 and then 10484; 10483 never arrived." Gaps are evidence about the emitter, and they matter at audit time, so they are drawn inline rather than hidden.
Narrowing down
Use the filters above the table:
- Window — preset ranges or a custom start and end.
- Agent — one agent, or all.
- System — one target system (the
mail,crm,dbthe agent touched), or all. - Outcome — successes, failures, or both. Failed actions are audit-relevant in their own right.
- Search — free text matched against identities, tool names and targets, plus semantic search over the same content when you phrase a question rather than a keyword. Searching "anyone touch payroll data friday afternoon?" finds records by meaning, not just string match.
- Vantage — whether the record came from the agent's own report (inside), a boundary system such as an IdP or SaaS audit log (boundary), or an import.
Every filter combination stays bookmarkable: the URL carries your query, so you can paste a filtered view into a ticket.
Counting and filtering
Beside the table, Value counts lists the values of each field for the window and filters you have set: how many records per source type, source, agent, system, action, outcome, error and model, with a share bar. Click a value to choose:
- Filter equals keeps only records with that value.
- Filter not equals drops them.
- Visualise redraws the chart above the table split by that field.
Each filter is a chip you can remove, and the whole set is in the URL, so a view can be pasted into a ticket. A field's own filter is left out of its own counts, so choosing one value still shows the others beside it. A record with no value for a field is counted under no value, and you can filter for those too.
Counts are exact for the window. For a very large window they cover the newest 100,000 records, and the panel says so rather than presenting a sample as the whole. The chart above the table shows records per day (per hour for the 24-hour window), split by outcome until you choose another field.
Opening a record in place
The arrow at the start of a row opens the record's stored properties under it, with a search box and a copy button. A value that matches one of the counted fields, such as the system or the outcome, can be clicked to filter by it. Content Provantix never stored, such as prompts and completions, shows as not stored, and a field erased after capture shows as erased with its date, so an absence is never a blank. Full record opens the drawer described below.
Where things happened
Under Approval in the value counts, records are counted as approved, missing approval (a sensitive action with no approval recorded) or not sensitive, and by approver (a handle, never a name). The same Approval column shows on every action. Filter to missing approval to see the sensitive actions nobody approved on record. See Approvals: who approved what.
Under Location in the value counts, records are counted by where the agent ran (region, country, cloud provider), where it acted (the target's region and country) and, if your organization allows it, which country the person behind the action is in. These are three different facts and are never added together.
- Location is declared by the source or derived from standard attributes in its telemetry. It is not verified, and each count is labelled that way.
- Nothing finer than a country and region is kept: no city, no address, no IP.
- The person's country is off by default. An admin turns it on under Settings, People tab, Where people are; it is kept with the person's other erasable data, so erasing the person removes it.
- A record from a source that sends no location counts under no value. Telemetry that carries cloud attributes (
cloud.region,faas.invoked_region) or an SDK emitter on a cloud runtime fills it in; see the record schema.
Reading a record
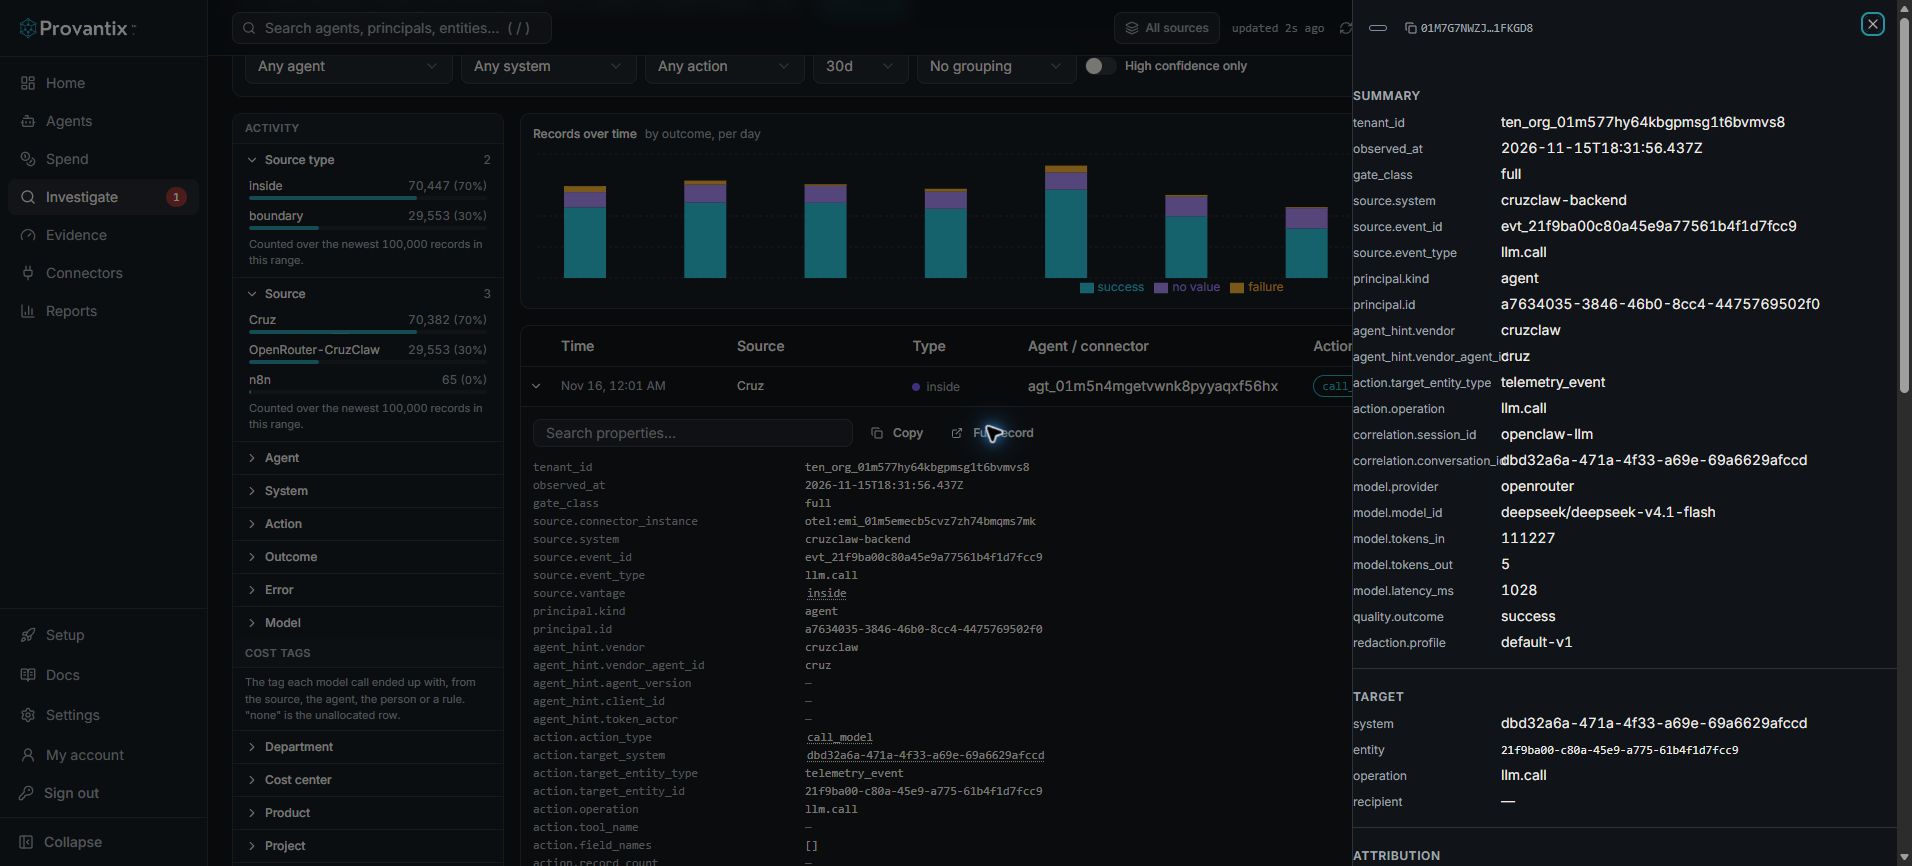
Product capture, 15–16 November 2026. Scroll inside the drawer for attribution, authorization, authority at the time and integrity information. Fields absent from this record must not be inferred.
Click any row to open the record drawer:
- Who and what — the agent, the owner it is attributed to, the action, the target, the outcome, and the tool arguments' data classes.
- Attribution — the method used to attach an owner (for example declared by the SDK, or inferred from token identity) and its confidence. Low confidence is a prompt to look at candidates, not an error.
- Integrity — the record's hash, its position in the emitter's chain, and the batch it arrived in. Copy integrity payload puts the sealed record — everything that is hashed and signed — on your clipboard. To actually check it, open the record's run view and press Verify: the app recomputes the hashes in your browser, from the record itself, and shows verified. No server round-trip is involved: the check is arithmetic you can repeat offline, and how verification works explains the math.
If several records belong to one logical task — one request, one approval, the agent, its sub-agents and their tool calls — the record links to the run view, which draws the whole chain.
From a number to its rows
Every count on Home, Reports and Coverage is a door into Investigate, not a dead end. Click through and you land on the exact rows behind the number, with the same filters applied. If a tile says 9 batch gaps, clicking it shows the nine gap rows in context, surrounded by the records that did arrive.
What to conclude here
Investigate answers "what happened" to the level an incident review needs: which agent, which action, which system, when, and whether the record verifies. What it means — whether that pattern is acceptable — is the job of findings, which reads the same records so the two pages always reconcile.