A tour of the workspace
Sign in at app.provantix.tech with your work email, your password and the one-time code from your email. You land in your organization's workspace. Every organization has its own isolated database, its own emitter keys and its own evidence — nothing is shared between organizations, and nobody outside your organization can see your records.
This page walks the left-hand navigation one item at a time: what each page is for, and the question it answers.
In the product
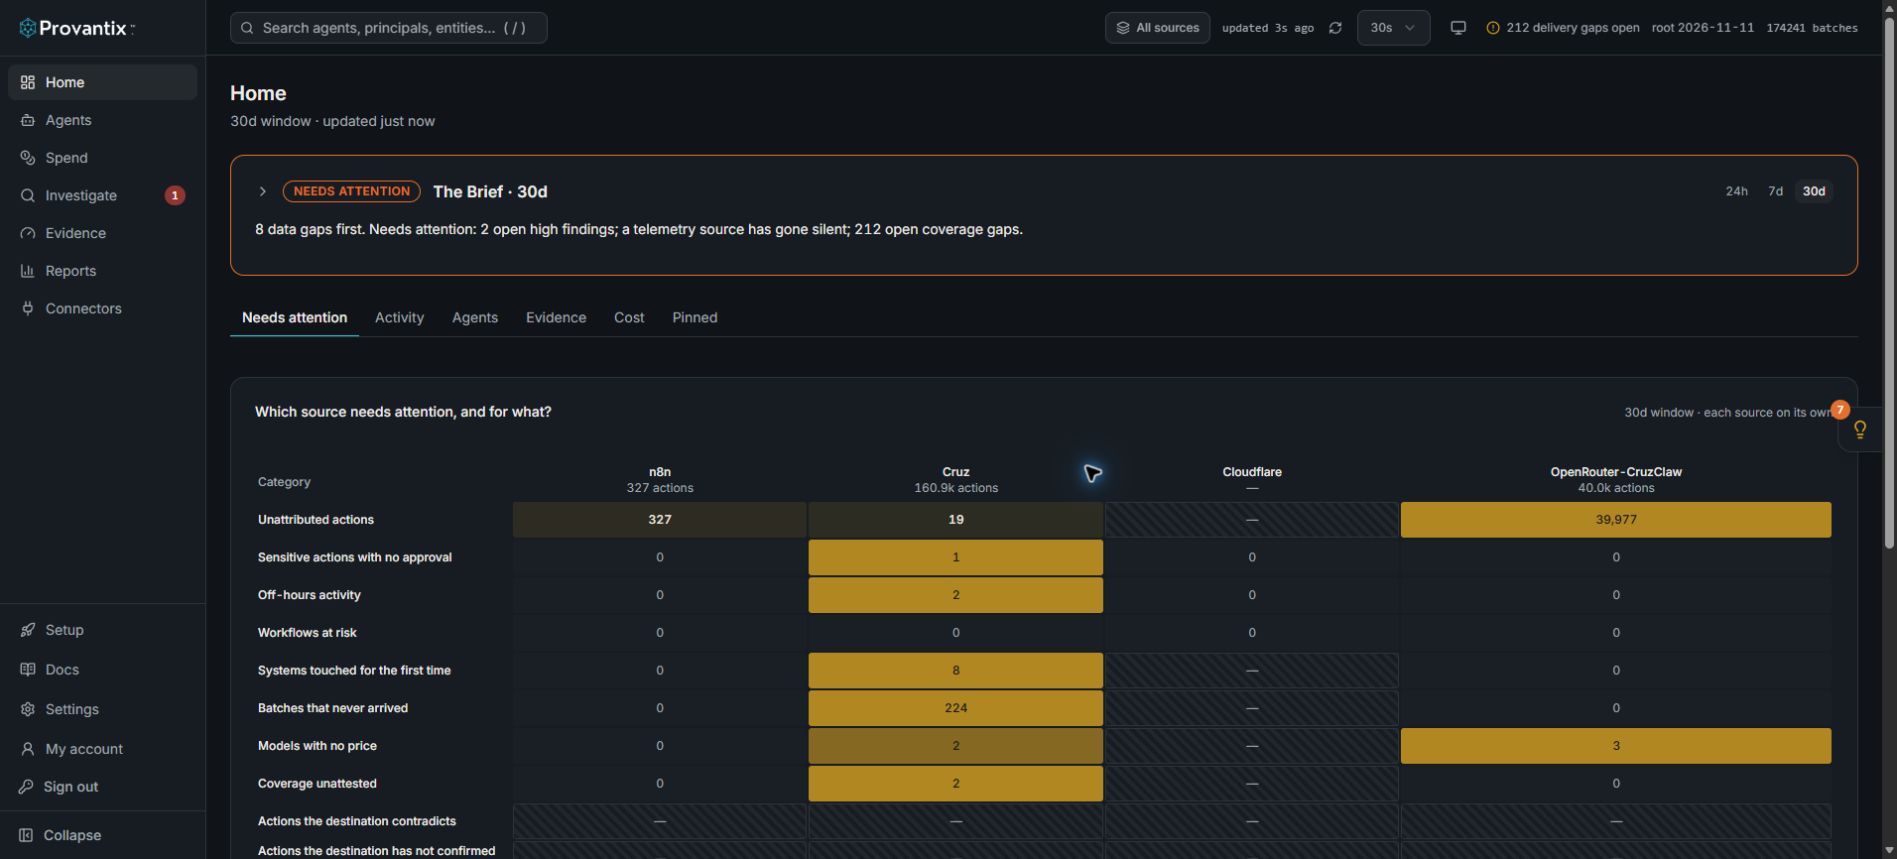
Product capture, 15–16 November 2026. Open the image for full size. Counts and dates are examples from the captured workspace.
Start with the Brief, then choose Needs attention, Activity, Agents, Evidence, Cost or Pinned. The left menu opens the other workspaces. Read gaps and missing data before interpreting the activity figures.
The navigation, entry by entry
The menu has seven entries. Most groups of related pages hold them as tabs across the top of the page, so related screens sit together. Every tab has its own address, so a link opens that tab. On a phone the menu is behind the button at the top left, and on a desktop it can be collapsed to icons.
| Menu group | Tabs | Question it answers | Learn more |
|---|---|---|---|
| Home | Needs attention, Activity, Agents, Evidence, Cost, Pinned | Was the period normal? What is wrong? What do I do first? | Reading the Home page |
| Agents | Inventory, Live state, Candidates | Which agents exist, who owns them, what is each doing now, and which new identities need a decision? | Agents and candidates, Fleet |
| Spend | Cost, Providers | What are my agents costing, split by agent, model, workflow and requester, against budget, and what does each provider itself report? | Cost, Providers |
| Investigate | Search, Findings, Incidents | What exactly happened, record by record? What has the platform flagged? What belongs to one incident? | Records and Investigate, Findings, Incidents |
| Evidence | Coverage, Decisions, Compare, Audit log | Is my evidence complete and sealed? Who approved, registered or attested what? What do the sources say side by side? What was every administrative action? | Coverage and attestation, The decision log, Sources and Compare |
| Connectors | Sources, Destination systems, Enforcement tools | Where is telemetry coming from, and is any source unhealthy? | Connectors |
| Reports | (one page) | Charts, model usage, saved questions and dashboards. | Reports and dashboards |
Below the groups are Setup, Docs, Settings, My account and Sign out. Settings has its own tabs: Evidence, Cost, People, Access and Delivery.
A number next to Investigate is the count of open high or critical findings, and a number next to Agents is the count of candidates waiting for a decision. The same numbers sit on the Findings and Candidates tabs. Each is a work queue: that many items are waiting for a human decision.
Small controls that are easy to miss
- Theme toggle (light/dark) is in the header. The product remembers your choice.
- Refresh re-runs the current page's queries against live data; nothing on screen is older than your last refresh.
- Org name in the header tells you which organization you are looking at. If you belong to more than one, switch there.
- Setup (below the groups in the menu) is where emitter keys and onboarding live — you use it once per telemetry source, then rarely.
- My account holds your profile and password. Sign out is in the menu.
Who should read which page
An operator who watches agents daily lives on Home, Findings and Investigate. An auditor or compliance lead lives on Coverage, Decisions, Reports and the export bundle. An engineer shipping telemetry lives on Setup, Connectors and the Shipping telemetry section. Start with the page that matches your job; every page assumes no prior knowledge.