Findings and what to do about them
A finding is a condition the platform has detected and keeps track of. Each finding has a kind, a severity, a subject (the agent, owner, emitter or budget it concerns), a detail sentence, and a recommended next step. The subject and kind together identify a finding, so the same condition on the same subject is one finding, however many times it is detected.
Findings are recalculated on a schedule. A new condition opens a finding. A condition that comes back after clearing reopens it. A condition that stops matching resolves it on a later run. Each finding moves through four statuses: open, acknowledged (someone has seen it and is handling it), resolved, and stale (the condition was not detected in the latest runs and the platform cannot tell whether it cleared).
The table below lists the 29 kinds the platform can produce, grouped by family. Severity is the default; a few kinds set it from the data, and the notes say so.
In the product
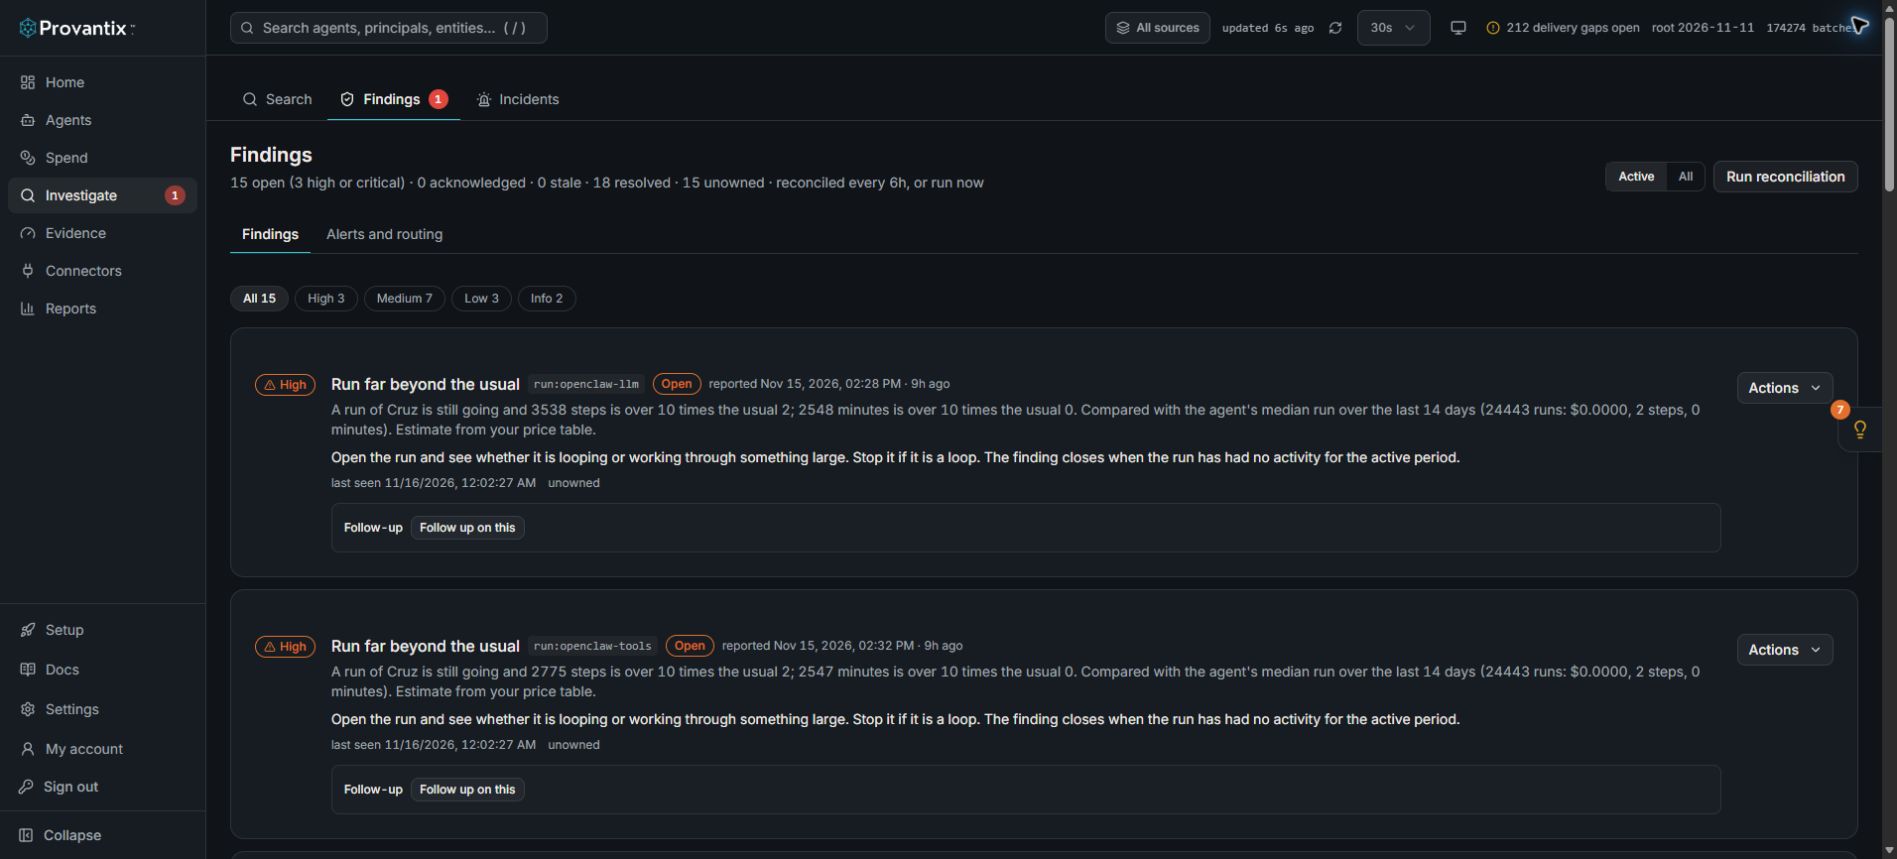
Product capture, 15–16 November 2026. Open the image for full size. Counts and dates are examples from the captured workspace.
Open Investigate, then Findings. Read each condition, subject and last-seen time before choosing an action. A finding is a reason to investigate; for example, a long run may be looping or doing substantial work. The screen alone does not establish the cause.
Identity and reach
These come from the agent inventory: who an agent is, which credential it uses, what it can reach, and who owns it.
| Kind | Severity | What it means | First move |
|---|---|---|---|
shared_credential |
high | One principal is mapped to more than one agent, so actions cannot be attributed to a single agent. | Give each agent its own credential, or confirm the sharing is intended and record it. |
non_exclusive_agent_principal |
medium | An agent's principal also shows interactive sign-ins or several client ids, which caps how confidently its actions can be attributed. | Move the agent to a dedicated service identity. |
human_account_acting_as_agent |
medium | Actions in the last 30 days were attributed to an agent but ran under a person's account. | Find out whether a person's credential is being used by the agent, and move the agent to its own identity. |
reach_mismatch |
high | An agent acted on a system it has no granted reach to. | Grant the reach if the access is expected, or investigate the actions. |
unowned_agent |
medium | An agent that is approved or active has no owner. | Assign an owner on the agent's page. |
standing_admin_grant |
high | An agent holds an administrative permission as a standing grant. | Confirm the grant is needed, or reduce it to what the agent does. |
aged_credential |
medium | The agent's credential is older than the 180-day policy. The detail gives its age. | Rotate the credential. |
inactive_agent |
low | The agent is marked active but has had no activity in 60 days. | Confirm the agent is still in use, or move it to paused or retired. |
candidates_for_review |
info | A non-human principal has been seen but is not mapped to an agent yet. | Review it on the Candidates tab (under Agents) and map it, or dismiss it. |
Data health
These report gaps in the evidence itself. They are findings, so they resolve when the data arrives.
| Kind | Severity | What it means | First move |
|---|---|---|---|
data_health.emitter_silent |
high when an emitter that had shipped stops for six hours or more; medium when it was registered and has never shipped | An expected emitter has sent no records. | Check the emitter process, its spool directory and the network path, then send a test batch. |
data_health.intake_silent |
high when a hosted intake source that had delivered goes quiet; medium when it has never received a delivery | A gateway or OTLP source has sent nothing. | Check the gateway or exporter's endpoint and token, then send a test delivery. |
data_health.untagged_agent |
medium | Spans in the last 24 hours named no agent. They are stored as unknown and cannot be attributed. | Tag requests with an agent identifier, or set a default agent on the intake token. |
data_health.signal_missing |
low | A signal that some findings depend on has never been observed: credential age, interactive sign-ins or permission grants. Those findings cannot be raised until the signal arrives. | Send the field the detail names from the emitter or connector. |
data_health.shadow_discovery_inactive |
low | Many records arrived, but no candidate principal has ever surfaced. Telemetry probably covers only the agents that were registered. | Stream telemetry for unregistered service accounts and helper scripts too. |
data_health.coverage_unattested |
medium | Agents are shipping records, but none of their agent–system pairs are attested or granted, so Coverage cannot tell expected activity from unexpected. | Attest the systems each agent may use on the Coverage page. |
data_health.guid_target_system |
medium | Records name a per-run identifier as the target system. Every run then looks like a new system, which breaks reach, coverage and cost grouping. | Send a stable system name as the target, and put the per-run identifier in the target entity field. |
data_health.seal_deadline |
medium, high within 14 days | An emitter still sends batches without its seal and the operator has set the date from which unsealed batches are refused. The finding names the date and the days left. Pilot and trial sources are not listed. Resolved when the emitter sends a sealed batch. | Upgrade the SDK to 0.2.0 (sealing is on by default) before that date. The emitter id, the key and the endpoint do not change. |
data_health.telemetry_paused |
high | The sealing deadline has passed and an emitter's batches are being refused because they lack its seal, so nothing from it is being stored. Resolved when a sealed batch is accepted. | Upgrade the SDK to 0.2.0 and restart the service. Batches already queued on the host are sealed when it sends them, so nothing it queued is lost. |
data_health.unsealed_batches |
medium | An emitter that used to seal its batches now sends them unsealed. The records are still accepted, but the emitter no longer vouches for them, so an auditor loses the emitter proof for everything sent from then on. One finding per emitter, resolved when a sealed batch arrives again. | Check that the emitter still runs the SDK version that seals batches: a downgrade, a rollback or a second process using the same identity are the usual causes. |
data_health.provider_credential |
high | A model provider's administrative key, connected to read its usage and cost, is rejected: revoked, expired, or no longer allowed to read. Nothing is collected from that provider until it is fixed. | Create a new read-only administrative key at the provider and rotate the connection to it. |
data_health.provider_stale |
medium | A provider connection has not pulled successfully for six hours. Figures from that provider stop at the last good pull. | Open the connection on the Providers page to see why. |
data_health.batch_gap |
medium | A collector's batch numbers skipped ahead, so the batches in between never arrived. Evidence inside a gap is missing, not empty. One finding per collector, resolved once every missing batch has arrived. | Open the trail on the finding to see which batches, check the collector is running and its delivery is not failing, then confirm the numbers resume in order. |
Spend
These need the cost data. They resolve when spend returns under the line.
| Kind | Severity | What it means | First move |
|---|---|---|---|
spend_over_budget |
high | Recorded cost for an agent, owner, team or the whole organization is above its monthly cap (month to date), or above its daily cap (today). | Raise the budget if the growth is expected; otherwise find what drove the spend. The Cost page shows the roll-up and the Fleet page the rate right now. |
untracked_ai_usage |
high | A provider reports more usage for a model than Provantix has records for, on settled days. The finding says the provider, model, how many days, the size in tokens and money, since when, and the provider's own split by project or key. It does not say why. | Find what is calling that provider without sending telemetry, starting from the provider's split, and connect it. |
cost_estimate_mismatch |
medium | On days when the tokens matched, the provider's cost differs from Provantix's estimate by more than the tolerance. | Check the price table against what the provider charges (a discount, a tier, an older price). Provantix does not change it. |
spend_anomaly |
medium | Today's recorded cost is more than five times the trailing 14-day median daily cost. | Check for a runaway loop, a new workload, or a price-table change. |
Cost is an estimate from the price table. See Data expectations for how estimates change when the table changes.
Behaviour
These compare what an agent does now with its own history or with the organization's declared hours. Each resolves when the condition clears.
| Kind | Severity | What it means | First move |
|---|---|---|---|
new_system |
low | An agent has its first activity on a system it had not used before. | Confirm the system is expected for that agent, and attest it if so. |
new_action |
info | An agent has its first action of a given type on a system. | Usually expected. Review it if the action is sensitive. |
volume_anomaly |
medium | An agent's actions today are more than five times its trailing 14-day median, or more than five times its own daily baseline on one system. | Check whether the workload changed, or whether a loop is running. |
off_hours_activity |
low | An agent acted outside the business hours the organization declared, in the last seven days. | Confirm the schedule is expected, or update the declared hours. |
active_after_retirement |
high when the agent is retired; medium when it is paused | An agent with a retired or paused lifecycle state has recent actions. | Find out who or what is running it, and stop it if it should not be running. |
reach_changed |
medium | An agent's granted or observed reach on a system changed in the last 30 days. | Review the change against the agent's intended scope. |
unclaimed_destination_change |
medium | The destination system holds changes (for example refunds) in a period it was collected for completely, and no agent claimed them. The cause is not known. | See A change nobody claimed. |
control_denied_but_executed |
high when the same action id is on both records; medium when the join is only probable | An enforcement tool recorded a deny for an action, and a record of that action exists. Provantix does not know where the enforcer sits, so it does not say the control failed. | Open the run to see the denial beside the action, and find out whether the enforcer was in the path for it. See Control decisions. |
action_without_control_decision |
medium | You declared that an enforcement tool covers changing actions on a system, and some of them since then have no verdict from it joined to them. Provantix cannot tell why: not in the path, down, or the verdict never arrived. | Open an example and check whether the tool saw that action. See Control decisions. |
evaluation_degradation |
medium | An outside evaluator reports a lower pass rate for an agent on the same dataset, under the same model, rubric and versions, than in the window before: the fall is at least 5 points and the two 95% ranges do not overlap. It is the evaluator's report, not Provantix's judgement of the answers. | |
repeated_call |
low or medium | An agent made the same call five or more times in a row in one trace or session (same tool and target, each within five minutes of the last, nothing different in between). Medium when every call failed. The records cannot tell a stuck loop from a retry, a poll or a pagination, so it says "repeated" and leaves the judgement to the owner. An agent with a declared run cadence is not reported for calls a minute or more apart. | |
consecutive_failures |
medium | An agent's most recent three or more calls in one trace or session all failed, with the first of them in the last 30 minutes. It does not say why. It closes when a later call succeeds, and is not raised again for calls already reported as a repeated call. | |
cost_spend_rate |
medium, high when far above | The fast check (every minute): an agent, department, product or the organization has spent per minute above a multiple of its own usual rate for this hour and weekday, for several minutes in a row. Says which baseline was used. | |
cost_runaway_run |
high | A run that is still going has passed a cost, step count or duration far beyond that agent's usual run. | |
cost_budget_crossed |
medium at 80%, high at 100% | A daily or monthly budget reached 80% or 100% of its cap. A budget blocks nothing. | |
cost_budget_forecast |
medium, high within 6 hours | At the cost rate of the last half hour a monthly budget will be crossed within the set number of hours. | |
cost_new_spender |
medium | A model or an agent that had never spent before has spent above a floor. It says it is new, not that anything is wrong. | |
cost_failure_burn |
medium | The cost of calls that failed is above a rate for several minutes in a row. | |
connector_failing |
medium | An alert connector (a pager, Slack, Teams, Jira or ServiceNow) has failed several sends in a row. It gives the last error, says alerts to it are falling to the next step of their route, and closes when a send succeeds. It does not say anything is wrong with the tool. | |
alert_undeliverable |
high | An alert on a route could not be delivered to any step, so nobody has been told. It says why and closes when the alert is acknowledged or clears. | |
cost_security_and_spend |
high | A high-severity finding is open on an agent whose spend rate is also above its usual. One event carrying both; it does not say one caused the other. | |
cache_hit_rate_fell |
medium | An agent's share of input tokens read from a cache fell against its own baseline (the last 3 days against the 14 before), on at least 30 calls that reported cache use on each side and a baseline share of at least 20%. It gives before and after, the calls and tokens behind each, an estimated extra cost a day, the first day and run where it changed, and any flag variant that first appeared at the same time (a coincidence, not a cause). Calls whose source does not report cache use are never counted as 0% and never raise it. It cannot say why. | |
tool_off_list |
medium, high when some of the calls change or send data | An agent's owner declared the tools it is meant to use, and its recent calls include a tool that is not on that list. It gives the counts, the tools, the cost recorded on the calls and who declared the list, and says "not on the declared list", never "unauthorised": the list may be out of date. An agent with no declared list is never reported. | |
expected_step_missing |
medium | The owner declared that an agent's runs should include a call to a tool (optionally on a system), and some ended runs since then did not. It gives the counts and examples and cannot say why: the agent may have skipped it, the step may not have been traced, or the run may not have needed it. | |
approval_does_not_cover_action |
medium | An action carried an approval that says what it covers, and the action is outside it: another target, over the limit, expired, or given under a different policy version. | Open the action and read which part does not hold. Either the action went beyond the approval, or the approval was recorded with the wrong details. |
sensitive_action_without_approval |
medium | Sensitive actions (delete, send, grant, revoke, download, or any action on an approval-required system) have no recorded approval in the last 30 days. | Record the approval where one was given, or require one for that agent. |
Early warning
These say a workflow is going wrong before its output is missed. They are comparisons against something the owner declared, not forecasts, and each resolves when the condition clears.
| Kind | Severity | What it means | First move |
|---|---|---|---|
missed_run |
medium; high when quiet for three times the declared interval | An agent whose owner declared how often it should run has shown no activity for longer than that. Nothing is measured for an agent with no declared interval. | Check the workflow and its emitter. See An agent missed its run. |
error_rate_rising |
medium; high when the failure rate is 25% or more | The share of an agent's calls with a known outcome that failed in the last 24 hours is at least 5%, at least double its own previous 14 days, and at least five points higher. Needs 20 calls in the last 24 hours and 50 in the 14 days before. | Find what changed: a dependency, a credential, a deploy or the input. See A workflow is failing more or running slower. |
latency_rising |
medium | An agent's median call latency over the last 24 hours is at least double its previous 14 days and at least 500 ms higher. Needs 20 timed calls in the last 24 hours and 50 before. | Check the model provider, the tools it calls and the size of what it sends. See A workflow is failing more or running slower. |
Alerts
The Alerts card on the Findings page (the Alerts and routing tab) sends a message when a finding opens, comes back, or rises in severity. A rule has a destination, a minimum severity, and optionally quiet hours and a daily digest.
- Email to a fixed address.
- Email the agent's owner. The message goes to the owner of the agent the finding is about, so the person who can act hears first. It works for findings about one agent, such as a missed run or a rising error rate. A finding that is not about a single agent, or about an agent with no owner, cannot be routed: the delivery log under the card records that it was not sent and why, so nothing is dropped silently. An owner rule has no daily digest.
- Webhook to an HTTPS address, signed so the receiver can check it.
A message carries the finding kind, severity, subject and a link, and never record content. Each finding sends once per rule and event, so a re-run does not repeat it.
Following up on a finding
A finding clears when the condition stops being detected. That is one fact. A different question is whether a decision someone took worked: did the condition improve, and stay improved? Follow up on this, under any finding, asks it.
You record three things: who is responsible, what was decided or done, and how long to watch (3, 7, 14 or 30 days). Provantix also records the latest human decision on the finding, such as who acknowledged it and why, and the condition as it was when you set the follow-up: its status, severity and how often it had opened in the last 30 days. Only an admin can set one. A finding has at most one follow-up being watched at a time.
When the window has passed, Provantix reads what happened from the checks it already ran, and records one of three outcomes:
| Outcome | What it means |
|---|---|
| Improved | The condition cleared, stayed clear for at least a third of the window (never less than a day), did not come back, and enough healthy checks ran, about one a day. |
| Not improved | The condition was still there at the end, or it cleared and came back. An acknowledgement is not a remedy: an acknowledged finding is still not improved. |
| Not enough evidence | Too few healthy checks ran, a source was in error, or the condition cleared too close to the end to know it stays clear. |
- An outage is never an improvement. When a source is in error the finding goes stale, not resolved, and a stale finding at the end is read as not enough evidence.
- Inconclusive readings are repeated. A follow-up with not enough evidence is read again about once a day for as long again as its window. If the evidence is still not there after that, it is closed as it stands and says so.
- Cancel. An admin can cancel a follow-up that is still being watched. It stays on record, with who cancelled it.
An outcome describes what happened to the condition after the decision. It does not show the decision caused it. The condition may have cleared for another reason, or come back for one. Every follow-up says so.
Setting or cancelling a follow-up is a human decision and appears on the Decisions page under follow-up. The reading itself is an operation, not a decision, and is recorded in the audit log.
Not findings
Some things look like findings on other pages but are not kept as findings:
- Sequence gaps. A batch that skipped a sequence number is a marker on the Home page and a gap on Connectors.
- Unattributed activity. Records that cannot be attributed are a coverage state, shown on Coverage, and the
data_health.untagged_agentfinding names the tagging problem behind them. - Coverage and gap hours. Coverage measures agent–system pairs. Connector gap hours are shown on the Coverage page.
- Sampling drift. Not implemented. The platform does not compare declared and observed sampling rates.
What to conclude here
A finding tells you that a condition exists, not that it is wrong. Acknowledge a finding when you have looked at it, record why in the status change, and resolve it only when the condition has actually cleared. A finding that stays open is a decision someone has not yet made. When you have made one, set a follow-up so that later you can see whether it improved the condition, with the limits stated there.