Tools and models: how each performs across an agent's runs
A single run shows a tree and a timeline. The Tools tab on an agent's page shows the other view: for each tool and model the agent called, how it did across all its runs in the last 7 or 30 days, with the period before it beside each figure so a change stands out.
| Column | What it is |
|---|---|
| Calls | How many calls in the period, and in the one before. |
| Failure rate | Failures out of the calls that recorded an outcome. |
| No outcome | Calls with neither success nor failure recorded. Counted apart and left out of the failure rate. |
| Median and slowest 5% | The median and the 95th percentile (nearest rank) of call duration. |
Durations come only from records that carry one: a span's end minus its start. A tool whose calls carry none reads not recorded, never zero. The median and the slowest 5% are over the calls that have a duration, and the API says how many that is.
In the product
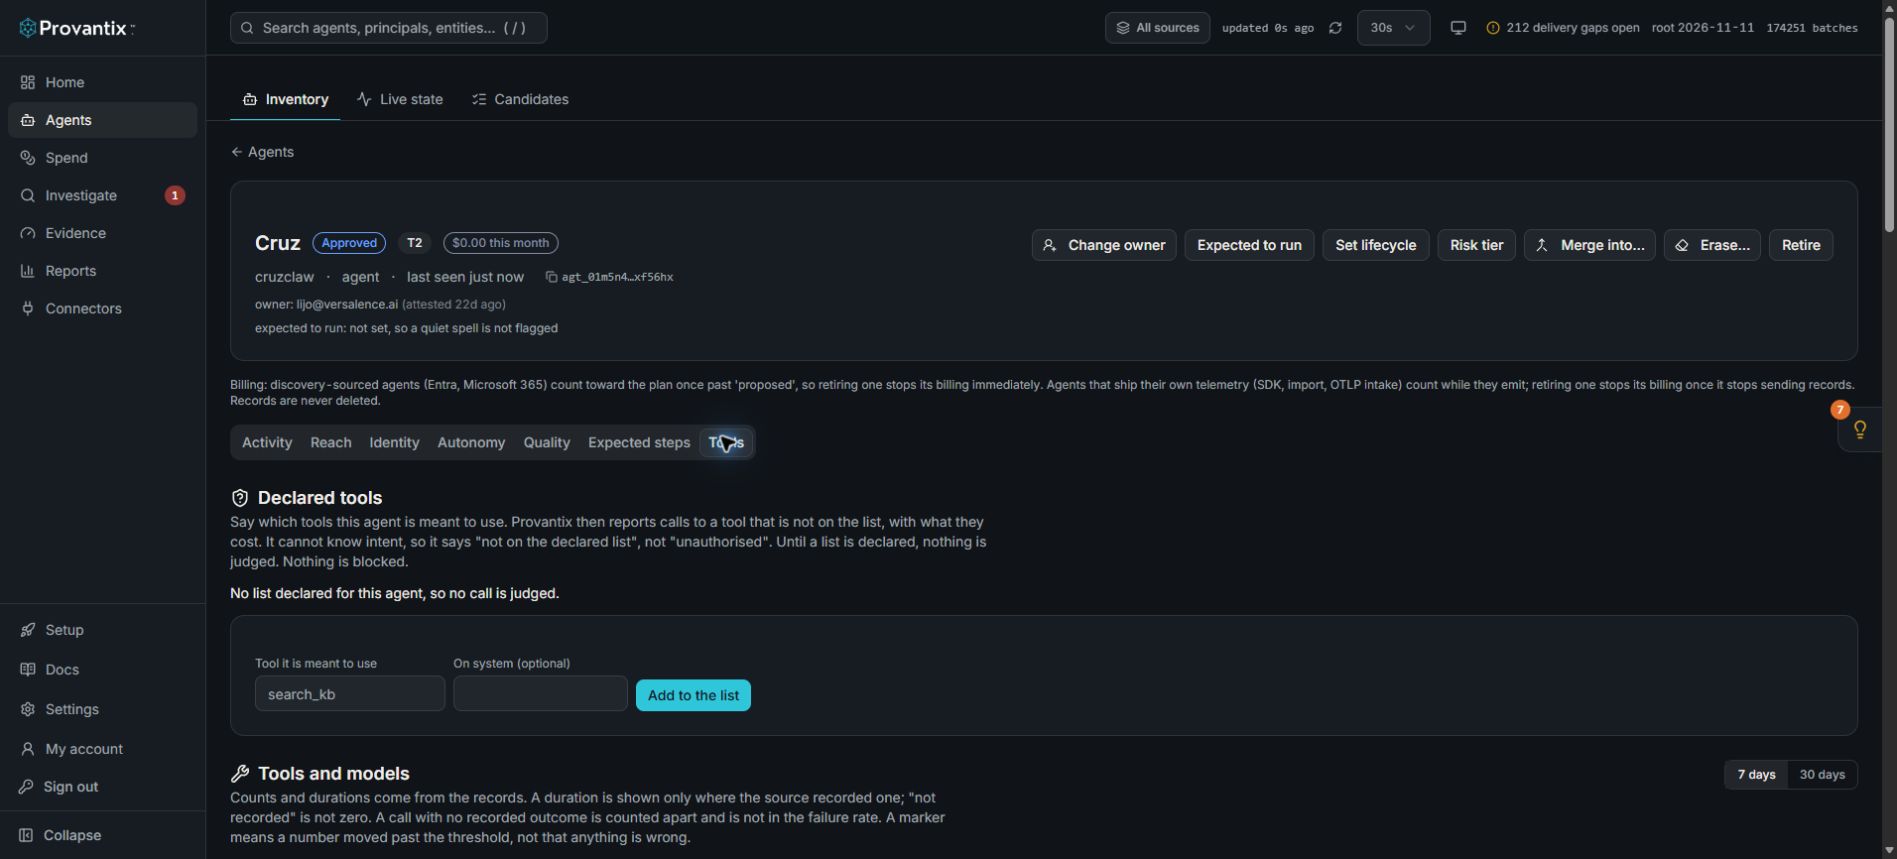
Product capture, 15–16 November 2026. Open the image for full size. Counts and dates are examples from the captured workspace.
Open an agent and select Tools. The Tools and models section compares calls, failures and durations with the preceding period. Keep the declared list separate from observed use: a declaration is not evidence that a tool was called.
Sub-agents
Where an agent hands work to sub-agents, their calls appear in the same table under their own name, marked as a sub-agent. They are found through the delegation chain on the record.
What stands out
A row is marked when its failure rate rose by 10 points or more, or its slowest 5% grew by half and at least 200 ms, and both periods have at least 10 calls to measure it on. The marker says where to look. It is not a finding, and it does not say that anything is wrong or why.
The same table is at GET /api/agents/{agent_id}/tools?days=7.
What it does not do
- It does not read what a tool was called with or returned.
- It does not say a tool is at fault: a rising failure rate can come from the tool, its caller, or the data it was given.